
2.3.2How fast was the car traveling on impact?
Sudden Impact
SUDDEN IMPACT, Part Two
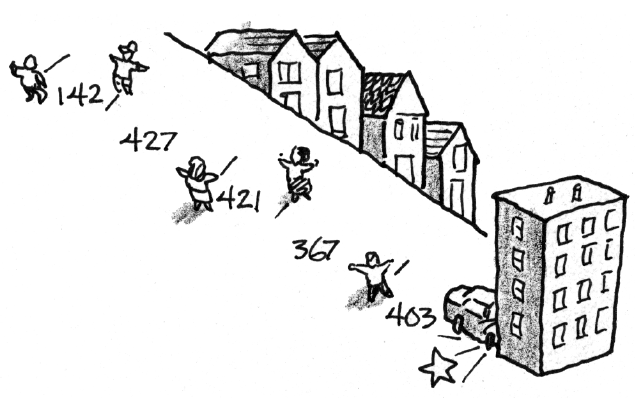
Ms. Dietiker still needs to determine the velocity her car was traveling down the hill when it slammed into the building so she can fill out her insurance report. Since she did not see the accident herself, she had to collect information from the students walking up the steep hill to school. (Fortunately, some of them were her calculus students who know the importance of collecting good data!)
Here were their statements:
Eric: | “I noticed the car start to roll at 7:54 and |
Joshua: | “It almost killed me at 7:55 and |
Lisa: | “It practically ran over me |
Samantha: | “I’ll mark the time 7:54 and |
Kirt: | “I noticed it took twice as long for the car to reach me as it did to reach Samantha.” |
Determine at what time and distance the car passes each person. Then plot the data on a distance vs. time graph.
These data points can be connected with a smooth “best fit” curve; describe the shape of this curve.
According to the curve of best fit, how long did it take for Ms. Dietiker’s car to slam into the building?
Determine how fast the car was traveling when it slammed into the building. Will Ms. Dietiker be able to collect on her insurance policy (see problem 2-102)?
Approximately when is the car traveling the fastest? How does the shape of the graph help you answer this question?
Note: Distances are in feet. |
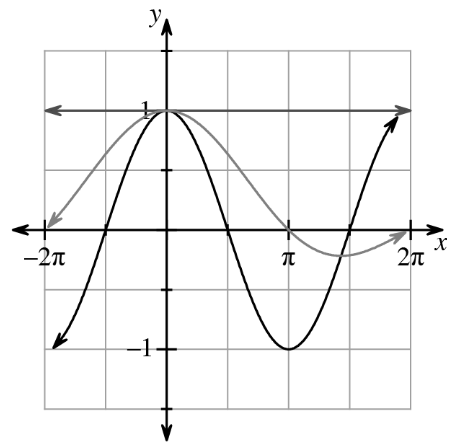
After Marlayna was playing with her graphing calculator, Sandy picked it up and saw the graph at right. Knowing her functions well, Sandy figures that Marlayna was examining a line. However, when Sandy looks at the function screen, the only equation in the calculator is
.png)
What happened? Can you recreate this graph of
on your graphing calculator? Find three more functions that appear to be linear when zooming in on the calculator at
. Marlayna has a conjecture. She thinks that all functions will appear linear when “zooming in” on the calculator at
. Can you find a counterexample to Marlayna’s conjecture?

While running in a straight line to class, Steven’s distance from class (in meters) was recorded on the graph at right. Homework Help ✎
Estimate his velocity (in meters per second) at
and seconds. Did Steven ever stop and turn around? If so, when? How does the graph show this?
Approximate the interval(s) of time when Steven was headed toward class.
.png)
A local fast-food restaurant records data on the rate customers enter their establishment during a typical lunch hour. Using this data in the table below, predict the total number of customers served during this
Time (min) | |||||||
Rate (cust/min) |
If
Jasmine is making another attempt to determine
On an interval around
Since
When the balloon in problem 2-81 reached
According to the model, when will the balloon hit the ground?
Approximate the balloon’s velocity at
seconds.
.png)
For each part below, draw a graph of a function that meets the given conditions, if possible. If such a function is not possible, explain why not. Homework Help ✎
is discontinuous at , but exists. is continuous at , but does not exist. is discontinuous at , and does not exist.
You have found (or approximated) the volume of a rotated flag with various shapes. What if the axis of rotation (the “pole”) is not attached directly to the flag?
In the graph at right, there is a gap between the flag and the x-axis. Decide what will occur when this flag is rotated about the
.png)


